Course
Data Analytics with R
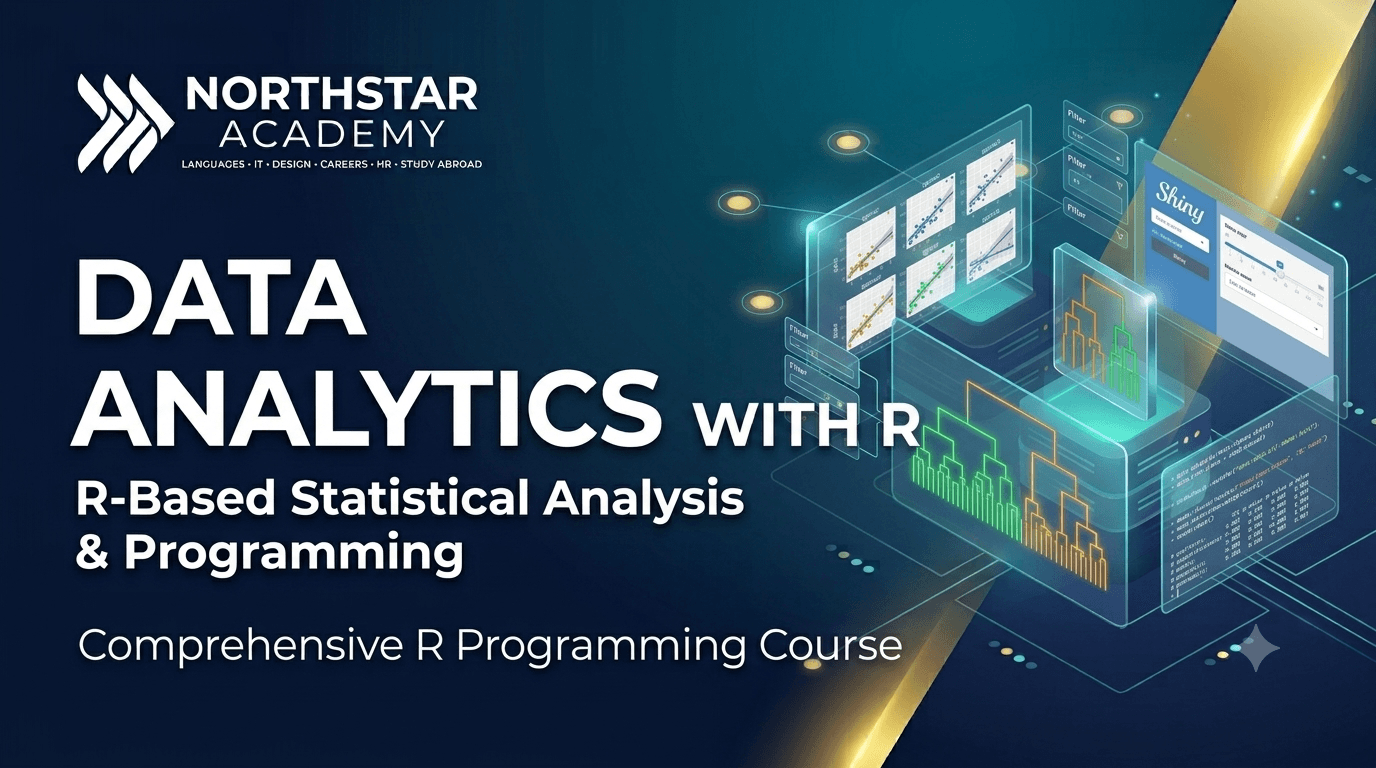
Learn statistical computing, data visualization, and reproducible data analysis using R and the modern tidyverse ecosystem.
Who this is for
Designed for students, researchers, analysts, and professionals who want to perform statistical analysis and data visualization using R. Suitable for anyone working with experimental, survey, healthcare, financial, or scientific data who wants to strengthen practical analytical skills.
R is one of the world's leading languages for statistical computing, research, and data analysis. This course teaches you how to work with data efficiently using the modern R ecosystem rather than focusing only on programming syntax. You will learn data manipulation with dplyr, data transformation with tidyr, visualization with ggplot2, statistical analysis, hypothesis testing, regression models, and reproducible reporting with R Markdown. The course also introduces interactive dashboards with Shiny and practical workflows used in research, healthcare, finance, and data science. Every topic is reinforced through real datasets and hands-on projects.
What you'll learn
R fundamentals, data types, control structures, and functions.
Data manipulation with dplyr and transformation with tidyr.
Data visualization using ggplot2 and exploratory data analysis (EDA).
Statistical analysis
probability, hypothesis testing, ANOVA, correlation, and regression.
Time series analysis and forecasting fundamentals.
Reproducible reporting with R Markdown and interactive applications using Shiny.
Practical data analysis project using real-world datasets.
10 weeks